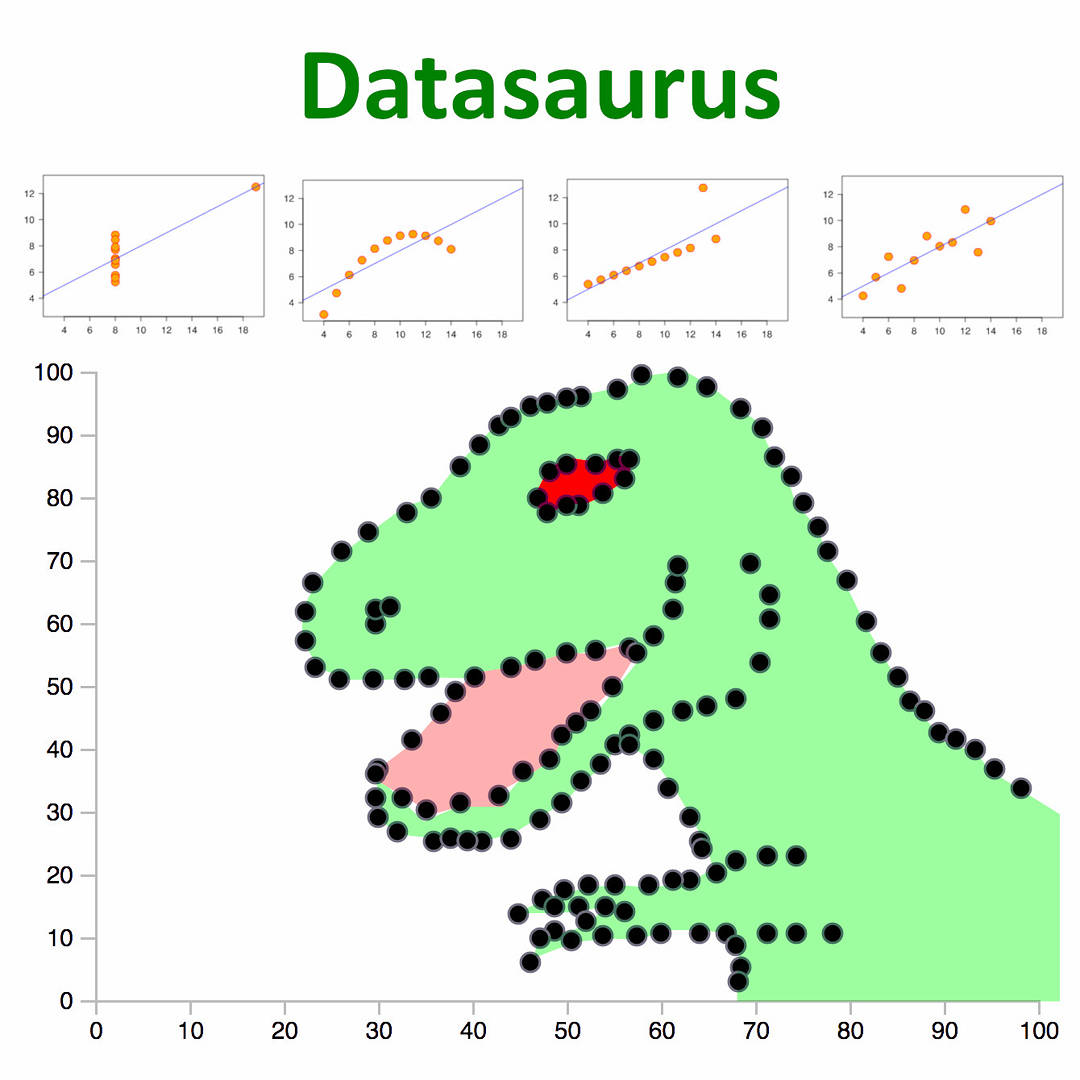

MBO managers love numbers like OEE, Cpk, dpm to use as a carrot or stick on employees. Some of these numbers such as OEE and Six Sigma levels, are blatant nonsense. Other numbers such as Cpk fail to tell the story of what is happening to a process.
In 1973 Francis Anscombe created the 4 data sets shown at the top of the image above, that have the same:
As you can see, the same parameters represent 4 completely different graphs. These parameters fail to give any idea of what the data represents. The only way to understand the data is to chart it.
Anscombe's work was recently extended by Justin Matejka who created the Datasaurus Dozen. They were so named because one of the plots looks like a dinosaur. Other plots showed stars, circles and lines.
It is the same when it comes to processes. There are no short cuts. Numbers such process capability are no substitute for a Process Behavior Chart. I discussed the inadequacies of capability indexes here: https://lnkd.in/eVW2EkTf
Suppose we collect 10 different data points from a process and we calculate a standard deviation and capability indexes. Depending on the TIME SEQUENCE of these 10 points, they can come from any one of 3,628,800 different Process Behavior Charts! Some of these charts may be in control and some may be wildly out of control. The capability indexes are incapable of indicating what the process looks like and whether or not the process is PREDICTABLE.
Whether it is Francis' Four, the Dinosaurus Dozen or Cp millions, summary statistics fail to tell the story.
The only comprehensive way to present your data for a process is the Process Behavior Chart. However, thanks to the Six Sigma Scam, most people have no clue what a Process Behavior Chart is or how to use it properly. I discuss the misuse of Process Behavior Charts here: https://lnkd.in/fuxA_ws
I discuss how to choose the correct chart here https://lnkd.in/gd8HQwim and how XmR charts are the Swiss Army knife of Process Behavior Charts, with my series here: https://lnkd.in/e_PGn7fY
When taught correctly, XmR charts are easy for every employee to understand and use effectively. Capability indexes are not enough. PLOT THE DATA.
 by Dr Tony Burns BE (Hon 1) PhD (Chem Eng)