
IMPACT on PRODUCTIVITY
In discussing our new Deming Funnel in Interactive Augmented Reality with Dr Wheeler, he gave an excellent example of the impact of tampering:
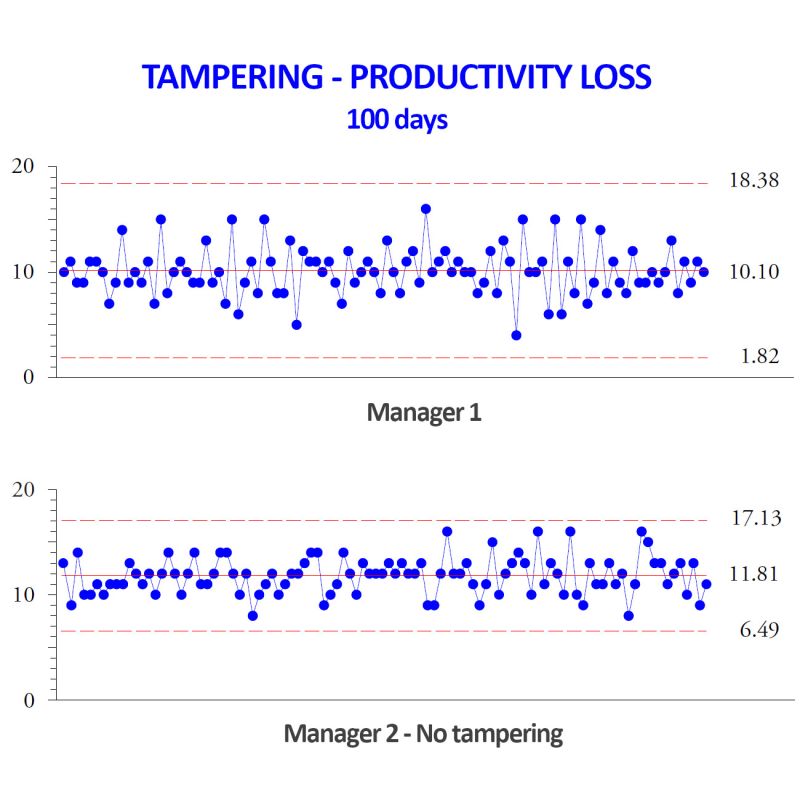
On the whole he ended up making adjustments over 80 percent of the time. The figure shows the X Chart for the plant output for 100 days under Manager #1.
MANAGER #2
Manager #2 succeeded Manager #1. He also looked at the Productivity Report each morning. However, he plotted the output values on an X Chart and only made adjustments to the operation of the plant when a point went outside the limits. The Figure also shows the X Chart for the plant output under Manager #2.
Manager #2 had one-third less variation than Manager #1 along with a higher average output, using the same work force in the same plant.
Manager #1's adjustments were so frequent (over 80 percent of the time) that the impact of those changes looked exactly like routine variation to the computations. Manager #1 had 150% of the variation displayed by Manager #2, along with a lower average daily output, yet his data appear to come from a predictable process.
"
STABLE PROCESSES but INCREASE in VARIATION
Both managers' processes appear stable and predictable. Our Deming Funnel in Interactive Augmented Reality demonstrates how even constant, 100%, Mode 2 tampering can appear stable, with no assignable (special) causes. However such tampering will produce an INCREASE IN VARIATION, as Dr Wheeler's example shows.
It is essential for all employees to have a thorough understanding of variation, in order to ensure good Quality.
Extract from: "But the Limits Are Too Wide!" - Dr Wheeler.
The 'DEMING FUNNEL' in Augmented Reality app is now available FREE in the app stores.
Download now. Have fun experimenting.
 by Dr Tony Burns BE (Hon 1) PhD (Chem Eng)